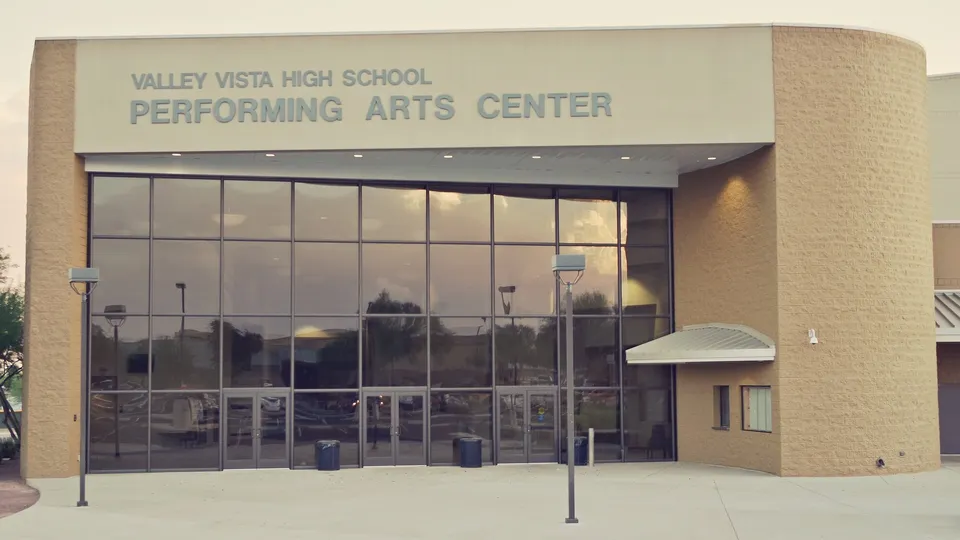
Valley Vista High School earned a 90% on the state's 2025-26 letter grades, released Oct. 28. That is the school's highest score under the state's current formula and its fifth straight A. It ranks 66th among Arizona's 230 traditional high schools, and fourth of Dysart Unified's four.
Valley Vista High School 2025-26 state letter grade
- District
- Dysart Unified
- Grade
- A, 90.0%
- Rank in Dysart
- 4th of 4 high schools
- Rank in Arizona
- 66th of 230
- A's in a row
- 5
- Principal
- Ginger Richards
Valley Vista earned a C in 2016-17, the first year of the formula, and B's the next two graded years. The state published no grades for 2019-20 or 2020-21. Valley Vista has earned an A every year since grades returned in 2021-22. In four of the last five graded years, its score has been the lowest of Dysart's high schools.
| School year | Grade | Score | Rank in Dysart | Rank in Arizona |
|---|---|---|---|---|
| 2016-17 | C | 62.0% | 3rd of 4 | 203rd of 269 |
| 2017-18 | B | 73.0% | 2nd of 4 | 103rd of 235 |
| 2018-19 | B | 74.1% | 4th of 4 | 98th of 226 |
| 2019-20 | No grades issued | |||
| 2020-21 | No grades issued | |||
| 2021-22 | A | 83.7% | 3rd of 4 | 73rd of 246 |
| 2022-23 | A | 82.2% | 4th of 4 | 70th of 229 |
| 2023-24 | A | 87.4% | 4th of 4 | 80th of 234 |
| 2024-25 | A | Not yet public | ||
| 2025-26 | A | 90.0% | 4th of 4 | 66th of 230 |
Ranks are among Dysart's four traditional high schools and among Arizona's traditional high schools, by the state's score. Dysart's online iSchool, graded as a high school in 2021-22 and 2022-23, scored below all four both years. The 2024-25 grade is from Dysart's report to its Governing Board; the state has not posted its final 2024-25 file.
Note: The state's overall percentage, bonus points included. No grades were issued for 2019-20 and 2020-21, and the state has not posted 2024-25 scores. The median is for traditional high schools. Years are school years ending in the year shown. Source: Arizona State Board of Education
Show the data
| year | Valley Vista | Arizona high school median |
|---|---|---|
| 2017 | 62.0% | 71.2% |
| 2018 | 73.0% | 71.1% |
| 2019 | 74.1% | 71.7% |
| 2020 | — | — |
| 2021 | — | — |
| 2022 | 83.7% | 73.5% |
| 2023 | 82.2% | 74.8% |
| 2024 | 87.4% | 81.2% |
| 2025 | — | — |
| 2026 | 90.0% | 83.4% |
How the grade is figured
Arizona grades a high school on five measures. Proficiency, how many students pass the state's tests, is 30% of the grade. Growth, how much their scores improve from one year to the next, is 20%. Graduation is 20%, college and career readiness is 20%, and English learners' progress is 10%. Schools can also earn bonus points on top.
The state's files break each school's grade into those parts.
| Year | Proficiency (30) | Growth (20) | Graduation (20) | Readiness (20) |
|---|---|---|---|---|
| 2017 | 13.3 | 12.5 | 15.0 | 13.1 |
| 2018 | 13.0 | 12.7 | 20.0 | 15.3 |
| 2019 | 14.1 | — | 20.0 | 15.6 |
| 2022 | 17.3 | 16.8 | 20.0 | 13.6 |
| 2023 | 18.8 | — | 20.0 | 15.3 |
| 2024 | 17.6 | 16.9 | 20.0 | 16.8 |
| 2026 | 17.4 | 18.8 | 20.0 | 17.8 |
Years are school years ending in the year shown. The most points possible in each part are in parentheses. The state's files for 2018-19 and 2022-23 give high schools no growth points; those years scored improvement among groups of students instead. Not shown are English learners, where Valley Vista earned all 10 points every year except 2022-23 (7), and was not graded in 2016-17; and bonus points, 2 a year through 2018-19 and 6 a year since.
This year's rise came from growth. Valley Vista earned 18.8 of 20 growth points, its most yet and 42nd among Arizona high schools. It was the first time its growth points were above the middle of Dysart's high schools.
- Valley Vista
- Dysart median
- Arizona median
Note: Growth is 20% of a high school's grade. The state's files have no high school growth points for 2018-19 or 2022-23. The Dysart median is the middle of its four high schools; the Arizona median is for traditional high schools. Source: Arizona State Board of Education
Show the data
| year | Valley Vista | Dysart median | Arizona median |
|---|---|---|---|
| 2016-17 | 12.5 | 13.5 | 13.2 |
| 2017-18 | 12.7 | 13.1 | 14.0 |
| 2021-22 | 16.8 | 16.8 | 16.2 |
| 2023-24 | 16.9 | 17.4 | 17.3 |
| 2025-26 | 18.8 | 18.3 | 17.1 |
Proficiency went the other way. Valley Vista's proficiency points have fallen two graded years in a row, from 18.8 in 2022-23 to 17.4 this year, while the middle of Dysart's high schools rose. This year's 17.4 is the lowest of the four, 2.7 points below the Dysart median, though still above the state's median.
- Valley Vista
- Dysart median
- Arizona median
Note: Proficiency is 30% of a high school's grade. The Dysart median is the middle of its four high schools; the Arizona median is for traditional high schools. Source: Arizona State Board of Education
Show the data
| year | Valley Vista | Dysart median | Arizona median |
|---|---|---|---|
| 2016-17 | 13.3 | 14.4 | 14.9 |
| 2017-18 | 13.0 | 13.9 | 13.7 |
| 2018-19 | 14.1 | 16.5 | 14.3 |
| 2021-22 | 17.3 | 18.2 | 14.8 |
| 2022-23 | 18.8 | 19.4 | 16.3 |
| 2023-24 | 17.6 | 19.2 | 15.9 |
| 2025-26 | 17.4 | 20.1 | 15.6 |
Graduation explains part of the low 2016-17 score. Valley Vista earned 15 of 20 graduation points that year, and all 20 in every year since.
College and career readiness
Valley Vista earned 17.8 of 20 readiness points this year, its most yet, but 146th of 228 high schools. It has been below the middle of Dysart's high schools every graded year except 2016-17.
The state scores readiness from what a school's seniors have done before graduating. School districts' explanations of the measure list things like passing college-level courses or exams, earning industry credentials and meeting test benchmarks.
It is a gap Dysart's high schools share. The middle of the district's four high schools has trailed the state's median on readiness every graded year, though the gap has narrowed, from 3.8 points in 2016-17 to 0.6 this year.
- Valley Vista
- Dysart median
- Arizona median
Note: Readiness is 20% of a high school's grade. The Dysart median is the middle of its four high schools; the Arizona median is for traditional high schools. Source: Arizona State Board of Education
Show the data
| year | Valley Vista | Dysart median | Arizona median |
|---|---|---|---|
| 2016-17 | 13.1 | 12.9 | 16.7 |
| 2017-18 | 15.3 | 15.4 | 16.4 |
| 2018-19 | 15.6 | 16.2 | 17.4 |
| 2021-22 | 13.6 | 14.7 | 16.1 |
| 2022-23 | 15.3 | 16.1 | 17.1 |
| 2023-24 | 16.8 | 17.0 | 18.1 |
| 2025-26 | 17.8 | 18.1 | 18.7 |
A higher curve
Valley Vista's scores rose as grades rose across Arizona. The state's median high school scored 71.2% in 2016-17 and 83.4% this year. About one in five Arizona high schools earned an A in 2016-17; this year, 128 of 230 did.
Part of that is in how the grade is built. Since 2022-23, the state has split the 20 graduation points into 10 for a school's graduation rate and 10 for improving it. This year, 85% of high schools earned all 10 rate points and 76% earned all 10 improvement points. Dysart's four high schools have earned all 20 every year since the split.
Bonus points add more. Valley Vista's 6 bonus points this year are the difference between 84.0% and 90.0%; without them, its score would still be above the state's median. The Arizona Auditor General reported in June that bonus points were "potentially inflating" grades statewide, and the State Board of Education has voted to drop them.
Valley Vista has also moved up against other schools. It ranked 203rd in Arizona in 2016-17 and 66th this year.
At the school
Principal Ginger Richards and Valley Vista's ninth grade English teachers presented their work to the Governing Board on Oct. 5, 2026. Richards said the team was chosen "because this team continues to grow students as evidenced by their reading Aspire score."
The team, Amanda Hryb, Amanda Grady, Crystal Romero, Brandon Packard, Alexandra Hurley and Matthew Bell, teaches 586 freshmen, which its slide called the largest freshman class in the district. The teachers described breaking state standards into weekly targets, planning backward from the unit tests and comparing results across classrooms to see whose approach worked. "We rise and fall together," one teacher told the board, "and the goal is to get every student across the finish line."
Asked what the middle schools could do to prepare students for ninth grade English, Richards said her teachers had told her "this is the best group of freshmen that they have had in a while."
Valley Vista also earned a B in 2013-14, under the state's earlier grading formula. That formula used a different scale, so its scores do not compare with the current ones.